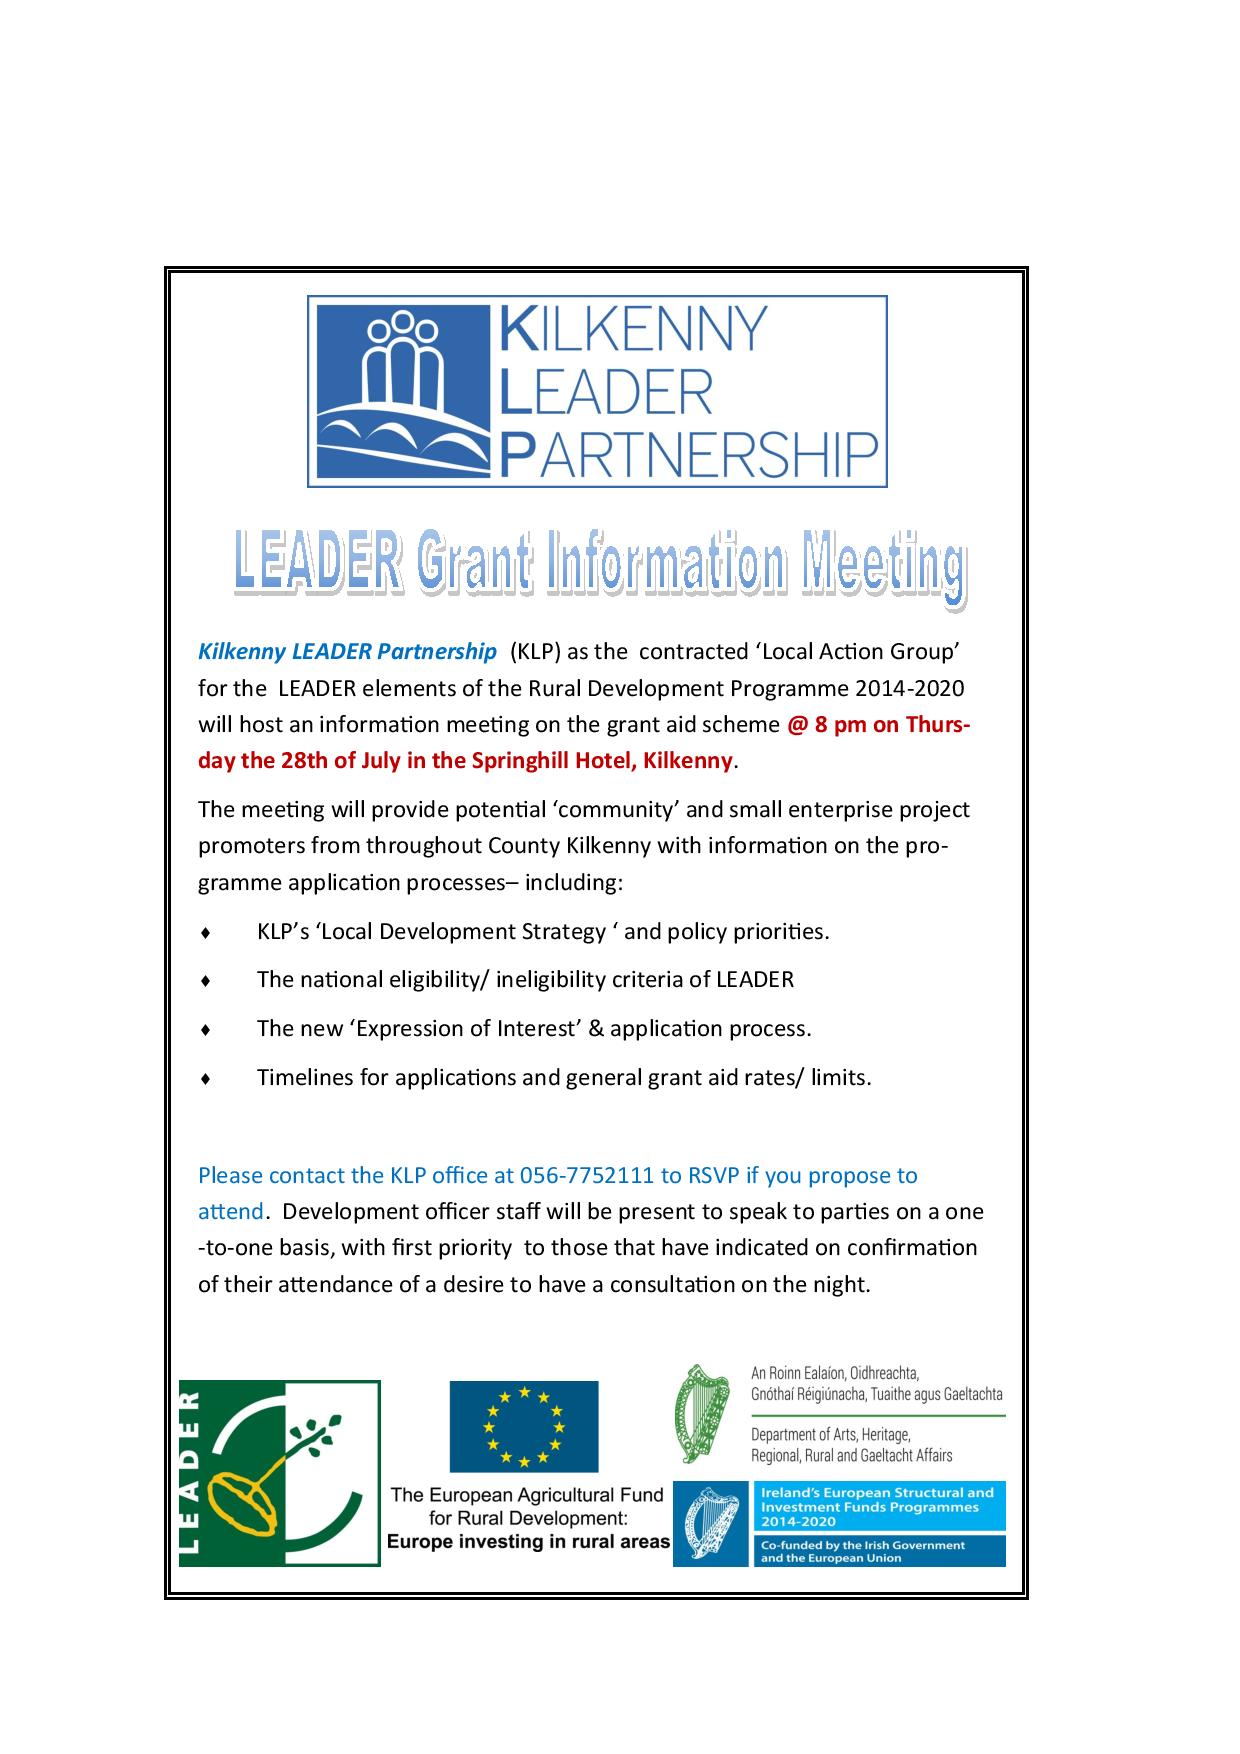
A GIS map of Kilkenny based on “larger area” statistics
Kilkenny LEADER Partnership (KLP) is currently in a planning phase. Not that that is all we are doing, of course! But the company is hard at work in the preparation of a strategic plan for the Local Community Development Programme (LCDP) and at the same time in the revision of the Rural Development Programme or LEADER.
NEW PROGRAMME NEW PLAN The LCDP is the long-awaited successor to the Local Development Social Inclusion Programme and its launch has been welcomed as a more focused initiative in terms of unemployment and training referral. KLP will organise over 20 consultation sessions with groups and agencies with an interest in social inclusion – ‘stakeholders’. KLP plans to have completed the process by the end of February and to make the application by the first week in March. All of the company’s social inclusion staff are hard at work in organising meetings attending information briefings and doing their regular work of meeting the needs for training and employment preparation of disadvantaged people.
JUNE 2008; A DIFFERENT WORLD The LEADER side of the company meanwhile is also busy working away on the implementation of the company’s strategies across the board- from food, tourism, community facilities and renewable energy. This is despite some serious illness absenteeism. Get well soon, Martin and Angela! And like their colleagues they too are busy revising the original LEADER plan first prepared and lodged by KLP’s foundation company Barrow Nore Suir Rural Development (BNS). Since the plan was completed in June 2008, the world has changed. So the KLP is taking the opportunity of a budget adjustment to look at what should be a priority now in terms of supports.
THE GOLDEN THREAD Least you think that these two process seem to be disconnected and are, “taking place in another part of the forest” to each other; there is an emerging common theme; a ‘golden thread’. Can you guess? It’s not too hard? Employment. No surprise that this has emerged as the big issue in terms of local development. And as I’ve stated before, we no more than any agency cannot create jobs. That’s down to entrepreneurs and opportunities. But we can ensure that our company’s focus is on assisting enterprise creation by business it supports through LEADER and on placing people in the right environment to enable them to take advantage of employment opportunities in the social inclusion section.
DATA OUT OF DATE; CARRY ON ANYWAY! It’s noteworthy that as the resources available to local development ‘sea’ reduce, the old rock and reefs of long-term unemployment re-emerge. An interesting point was made by Trutz Haase, the originator of the’ relative poverty’ indicators. These are usually presented in a coloured map-from; red for poorest green for least poor, etc. This is the Graphical Information Systems (GIS) often mentioned by statisticians. Anyway Hasse stated at an information meeting that introduced the exciting (no really) prospect of more detailed information at street and townsland level- so-called ‘small area’ statistics and mapping, that even though the new mapping would be based on 2006 data – that’s a full two years before the fall, remember; the levels of deprivation might have changed but the areas of deprivation would have basically remained the same-relatively speaking. So we could work away on the 2006 data safe in the knowledge that in the good times and bad times the poor really are not only always with us –they don’t change address!
EVEN WHEN THE POOR HAVE IT GOOD; THEY HAVE IT BAD (RELATIVELY!) This frightening fact, and on reflection we believe it is basically true, would seem at first glance to condemn all we have collectively done in the social inclusion sector over the last twenty years. But on mature reflection (as topically, a politician might say) it more accurately illustrates the difficulty in improving the lot of disadvantaged people relative to others. By that we mean that in the good time things do get better for them- but not as much as they do for the wealthier parts of population. And in bad times they lose and suffer more than the rich. What the small areas GIS system will allow KLP to do is to focus rather than broadcast its services to ensure we get to those that need it most.
CAN’T COUNT; WON’T COUNT The LCDP programme has a welcome- from KLP’s stance anyway, emphasis on quantifiable metrics. That’s figures to you and me. Welcome but also daunting. No pfaffing about when it can be measured; you have to produce the evidence. I have spoken before about KLP’s ‘Employability Strategy’ and about the potential of the TÚS programme to assist it and the LEADER programmes strategies as mentioned above. But in so far as I can get excited about statistics, I am genuinely enthusiastic to see what difference the small area mapping will make to our work. Right across the company numbers will become how we judge success- and failure. It might be too crude to state, “if can’t count it – we won’t count it!” So many interventions are obviously beneficial that qualitative descriptions seem the only way to record them. But like it or not, numbers are the future.
The LEADER plan revision too will place a special emphasis on metrics- particularly in the employment sector- jobs. But the current LEADER plan rightly places a focus on developing the physical infrastructure and social networking that will directly and indirectly support rural development. We believe that this type of long-term strategic development work is essential to LEADER’s success. But like the LCDP’s qualitative work, it will be a challenge will be to find a way to reflect it in metrics too. Interesting times.
Declan Rice